Performance logs
-
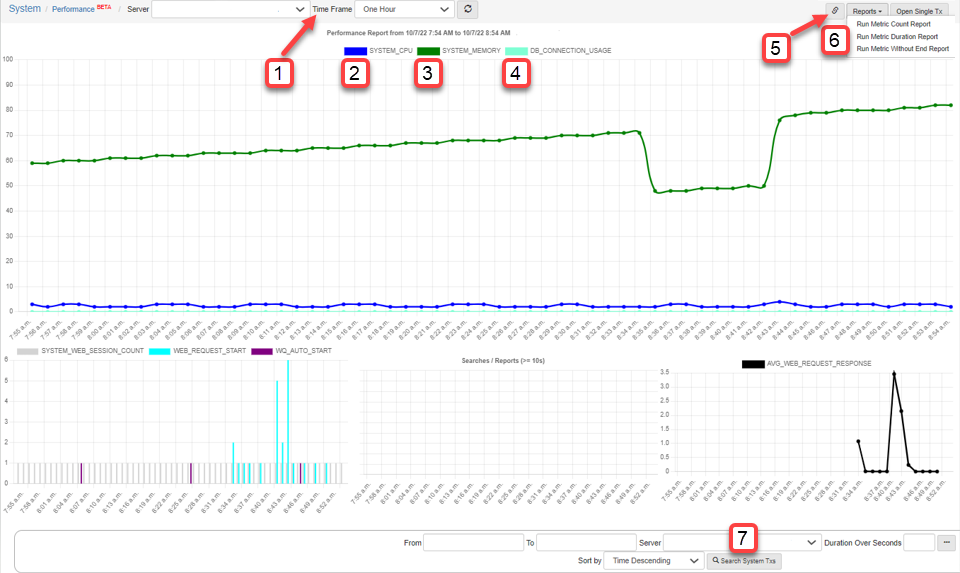
The Performance Screen gives basic information about eAttorney.
-
It stores about 30 days of data.
-
It tracks CPU usage, memory usage, and database connection usage.
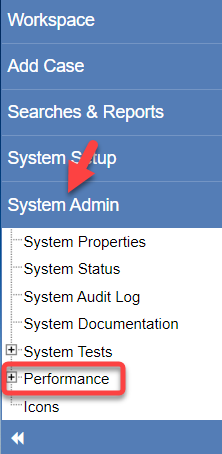
To navigate to your performance screen, select System Admin then click Performance.

The Performance Screen shows:

-
You can change the time frame of your system usage at the top.
-
The System CPU should be 20-30%.
-
The Max memory usage should be around 70%. Fluctuation is normal and acceptable.
-
The Database connection usage should be around 0%.
-
The copy report link copies the report for another person. They do not have to be logged into eAttorney to be able to see the performance screen.
-
You can run several reports:
-
Metric Count Report:
-
The threshold in the metric count report is measured in milliseconds.
-
This report can detect system operations that caused high memory usage and/or system slow downs.
-
If only the start date is given the whole date is queried.
-
This report measures the duration of how long screens take to load and how many times they have loaded.
-
-
Metric Duration Report:
-
This report can detect system operations that caused high CPU usage or blocked database queries.
-
If only the start date is given the whole date is queried.
-
This reports shows how long screens take to load.
-
In this report, you enter dates and times.
-
If the threshold in seconds is 30 seconds or longer it needs to be analyzed.
-
-
Metric without End Report:
-
This report can detect system operations that caused high memory usage and/or system slow downs.
-
Note: if only the start date is given the whole date is queried.
-
Also, take into account system restart when determining if the restart cancelled the operation.
-
This report tells you if there are running operations that should have ended.
-
-
-
You can also search system Txs.